Airbnb Amsterdam
All the files of this project, except the Carto map, are saved in a GitHub repository.
Objective
This case study aims to explore and visualize Airbnb listings in Amsterdam. It uses a dataset available on Kaggle which lists all the properties available on the platform on December 6th, 2018.
The overarching objective of the visualization is to convey the best Airbnb listings for leisure travelers. The typical leisure traveler prefers staying within walking distance of major landmarks, i.e. between 500 meters and 2 kilometers of the said attractions, though not in their immediate vicinities as those tend to be crowded, noisy, and overpriced. Listings in the immediate vicinity (500 meters) of the top 10 tourist attractions will be labeled as ‘Homes to avoid’.
Data Preparation
From the dataset, we use only the files listings_details.csv and listings.csv, which need to be merged and cleaned. The missing ratings are imputed with the lowest score.
A new feature is created to calculate the price of each listing for 2 nights and 2 people. This will allow to simulate a user search and compare prices taking into account all the listing conditions.
#####
### THIS SCRIPT PREPARES THE AIRBNB LISTINGS DATASET
####


# Loading and merging files
listings_details <- read.csv('data_input/airbnb-amsterdam/listings_details.csv', sep=',')
listings <- read.csv('data_input/airbnb-amsterdam/listings.csv', sep=',')

listings_merged <- merge(x = listings, y = listings_details, by.x = 'id', by.y = 'id')
str(listings_merged)

# Selecting interesting columns
cols <- c('id','room_type.x','property_type','accommodates','bathrooms','bedrooms',
        'beds','bed_type','latitude.x','longitude.x','neighbourhood.x','is_location_exact',
        'host_id.x','host_name.x','host_response_time','host_response_rate','host_is_superhost',
        'host_total_listings_count','host_has_profile_pic','host_identity_verified','price.x',
        'weekly_price','monthly_price','security_deposit','cleaning_fee','guests_included',
        'extra_people','minimum_nights.x','maximum_nights','calendar_updated','has_availability',
        'availability_30','availability_60','availability_90','availability_365.x','instant_bookable',
        'is_business_travel_ready','cancellation_policy','require_guest_profile_picture',
        'require_guest_phone_verification','number_of_reviews.x','reviews_per_month.x','review_scores_rating',
        'review_scores_accuracy','review_scores_cleanliness','review_scores_checkin',
        'review_scores_communication','review_scores_location','review_scores_value')

clean_listing <- listings_merged[cols]
str(clean_listing)

# Cleaning data formats and values
library(stringr)
clean_listing$host_response_rate <- str_replace_all(clean_listing$host_response_rate, '%','')
clean_listing$host_response_rate <- str_replace_all(clean_listing$host_response_rate, 'N/A','NA')
clean_listing$host_response_rate <- as.numeric(clean_listing$host_response_rate)
clean_listing$host_response_rate <- clean_listing$host_response_rate/100

clean_listing$weekly_price <- as.numeric(clean_listing$weekly_price)
clean_listing$monthly_price <- as.numeric(clean_listing$monthly_price)
clean_listing$security_deposit <- as.numeric(clean_listing$security_deposit)
clean_listing$cleaning_fee <- as.numeric(clean_listing$cleaning_fee)
clean_listing$extra_people <- as.numeric(clean_listing$extra_people)

str(clean_listing)

# Changing column names
names(clean_listing) <- c('home_id','room_type','property_type','accommodates','bathrooms','bedrooms',
                         'beds','bed_type','latitude','longitude','neighbourhood','is_location_exact',
                         'host_id','host_name','host_response_time','host_response_rate','host_is_superhost',
                         'host_total_listings_count','host_has_profile_pic','host_identity_verified','price',
                         'weekly_price','monthly_price','security_deposit','cleaning_fee','guests_included',
                         'extra_people','minimum_nights','maximum_nights','calendar_updated','has_availability',
                         'availability_30','availability_60','availability_90','availability_365','instant_bookable',
                         'is_business_travel_ready','cancellation_policy','require_guest_profile_picture',
                         'require_guest_phone_verification','number_of_reviews','reviews_per_month','review_scores_rating',
                         'review_scores_accuracy','review_scores_cleanliness','review_scores_checkin',
                         'review_scores_communication','review_scores_location','review_scores_value')

# Adding new feature: price for 2 people 2 nights
clean_listing$price_two_nights_two_people <- clean_listing$price * 2 + clean_listing$cleaning_fee + (clean_listing$guests_included-2 < 0)*abs(clean_listing$guests_included-2)*clean_listing$extra_people
head(clean_listing[, c('price', 'cleaning_fee', 'guests_included', 'extra_people', 'price_two_nights_two_people')],10)

# Reorganizing columns
col_order <- c('home_id', 'property_type', 'room_type', 'accommodates', 'bathrooms', 'bedrooms', 'beds', 'bed_type',
               'longitude', 'latitude', 'neighbourhood', 'is_location_exact',
               'host_id', 'host_name', 'host_is_superhost', 'host_response_time', 'host_response_rate',
               'host_total_listings_count','host_has_profile_pic','host_identity_verified',
               'price', 'weekly_price','monthly_price','security_deposit','cleaning_fee','guests_included', 'extra_people', 'price_two_nights_two_people',
               'minimum_nights','maximum_nights','calendar_updated','has_availability', 'availability_30','availability_60','availability_90','availability_365',
               'instant_bookable', 'is_business_travel_ready','cancellation_policy','require_guest_profile_picture', 'require_guest_phone_verification',
               'number_of_reviews','reviews_per_month','review_scores_rating', 'review_scores_accuracy','review_scores_cleanliness','review_scores_checkin', 'review_scores_communication','review_scores_location','review_scores_value')

listings_clean <- clean_listing[col_order]

# Saving CSV file
write.csv(listings_clean, 'data_output/listings_clean.csv')

# Imputing missing ratings
summary(listings_clean$review_scores_rating)
listings_clean$RATING <- round(listings_clean$review_scores_rating,0)
summary(listings_clean$RATING)
listings_clean[is.na(listings_clean$RATING),'RATING'] <- 20

# Saving CSV file
write.csv(listings_clean, 'data_output/listings_clean_ratings.csv')
Top 10 Attractions
The list of the Top 10 attractions of Amsterdam has been collected from a travel website, and their coordinates manually found on Google Maps:
- The Rijksmuseum
- The Anne Frank Museum
- The Van Gogh Museum
- Vondelpark
- Dam Square
- The Royal Palace
- Rembrandt House Museum
- The Botanical Gardens and the Zoo
- The Old Church (Oude Kerk)
- The Jewish Historical Museum
Exploratory Data Analysis
Multiple plots have been prepared to explore the listings information. The most interesting ones are shown below.
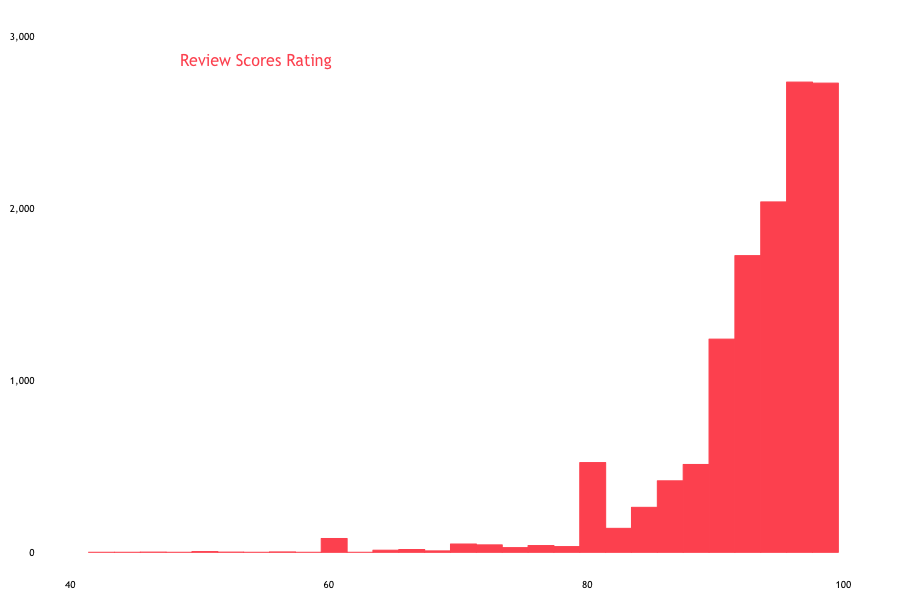
Distribution of Listings by Scores Rating, out of 100
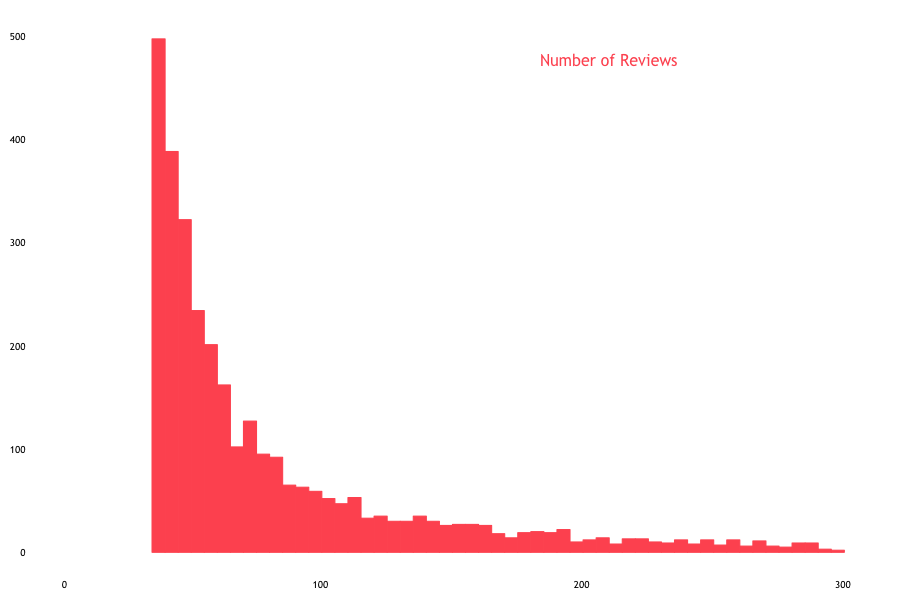
Distribution of Listings by Number of Reviews
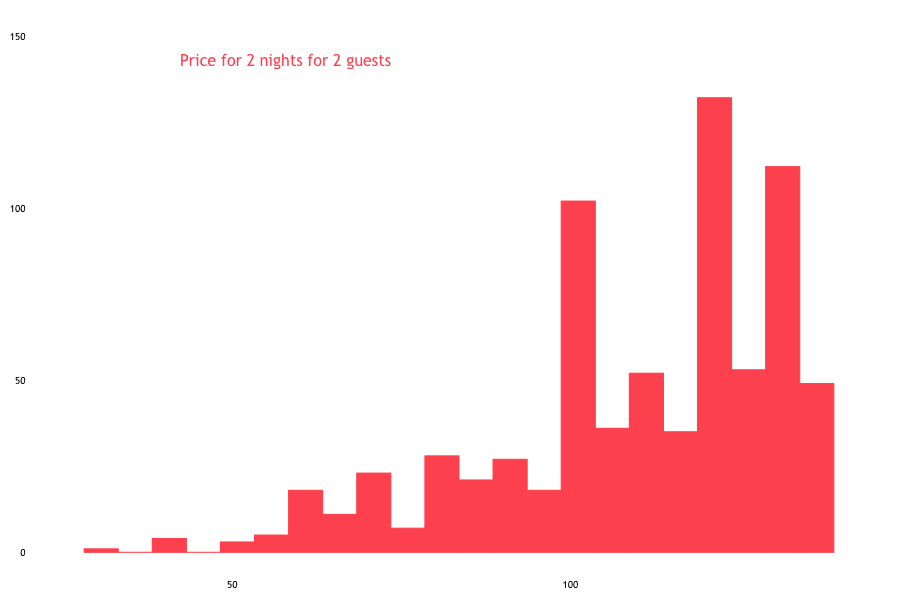
Distribution of Listings by Price for 2 Nights for 2 Guests
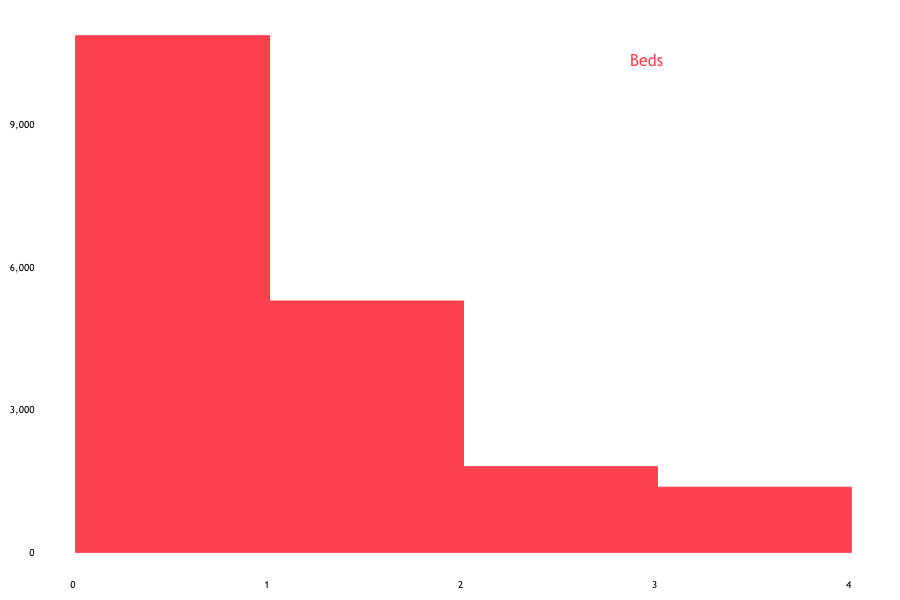
Number of Beds per Listing
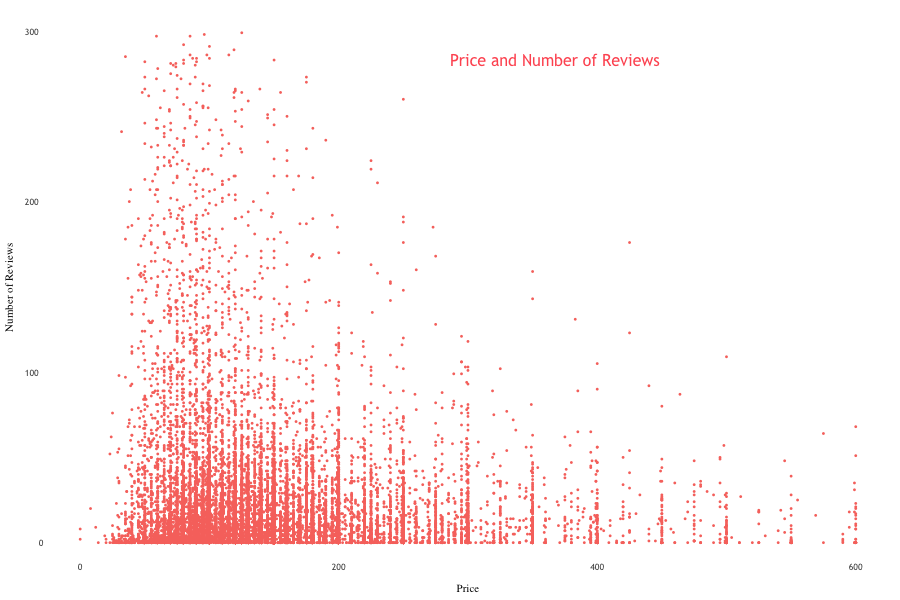
Number of Reviews per Price for 1 Night
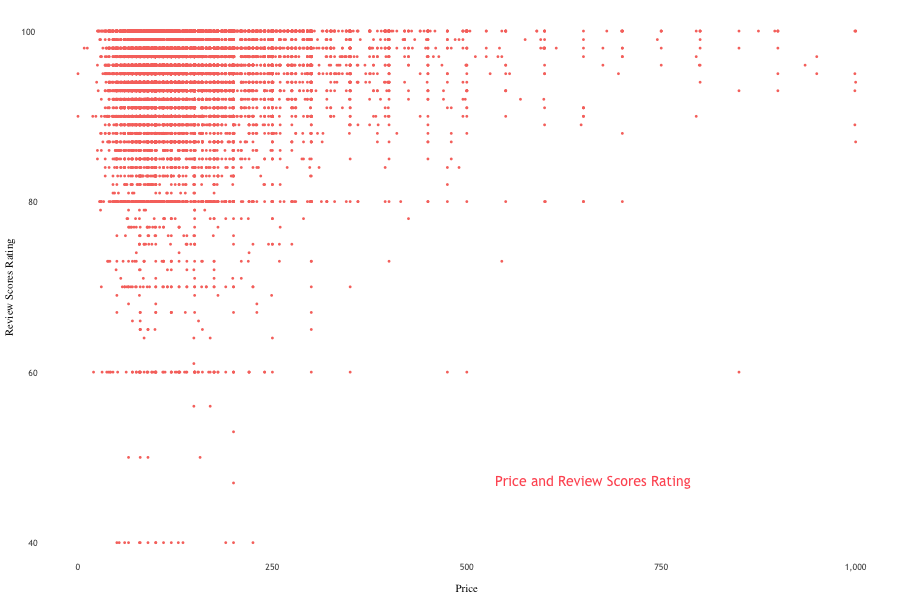
Scores Ratings per Price for 1 Night
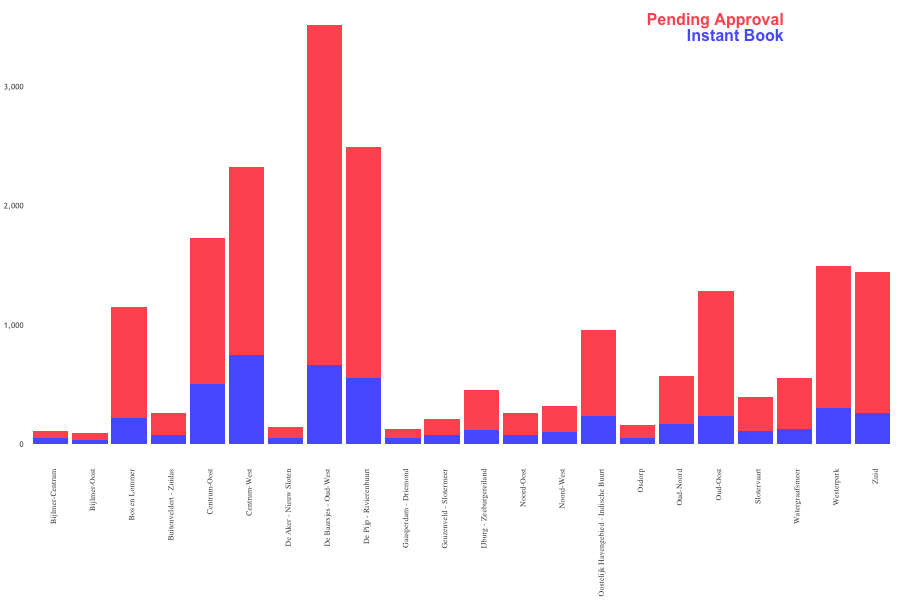
Number of Listings – Breakdown by Type of Reservation and Neighborhood
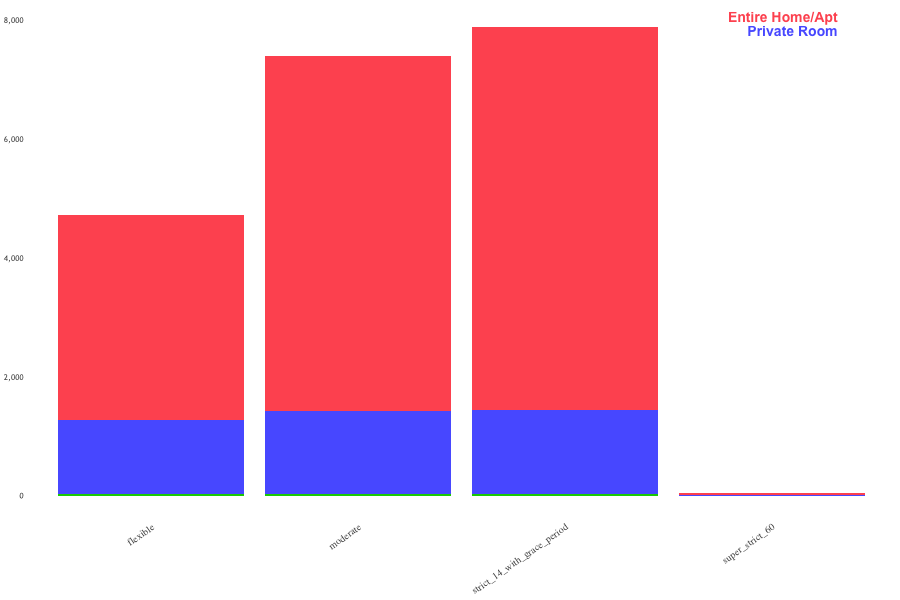
Number of Listings – Breakdown by Type of Home and Cancellation Policy
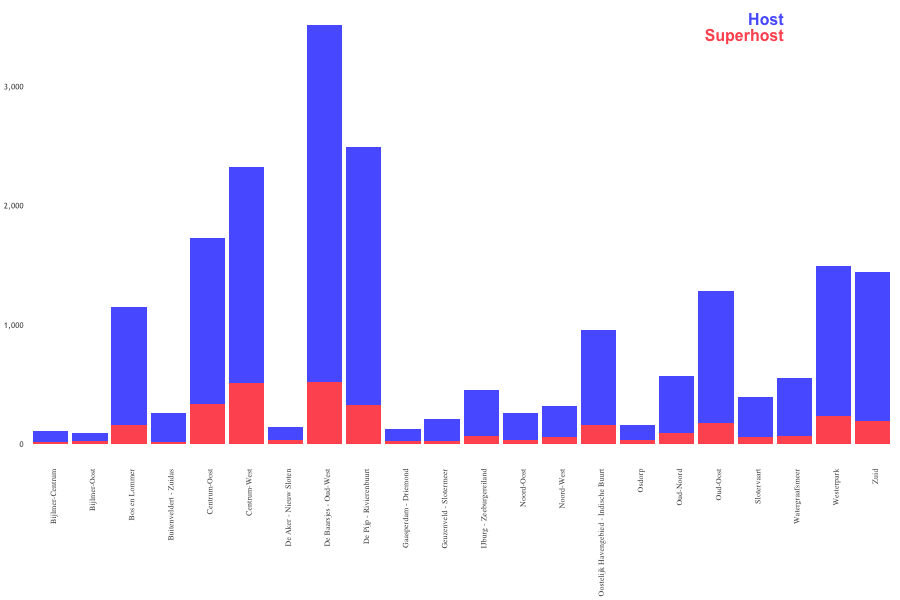
Number of Listings – Breakdown by Type of Host and Neighborhood
#####
### THIS SCRIPT PLOTS LISTINGS INFORMATION
#####

# INSTALL AND LOAD PACKAGES ----
packages_list <- c('ggplot2',
                   'ggalt',
                   'gridExtra',
                   'scales',
                   'grid',
                   'lattice',
                   'ggthemes',
                   'extrafont',
                   'plotly',
                   'plyr',
                   'leaflet',
                   'maps'
)

for (i in packages_list){
  if(!i%in%installed.packages()){
    install.packages(i, dependencies = TRUE, repos = "http://cran.us.r-project.org")
    library(i, character.only = TRUE)
    print(paste0(i, ' has been installed'))
  } else {
    print(paste0(i, ' is already installed'))
    library(i, character.only = TRUE)
  }
}


# READ DATASET ----
data <- read.csv('data_output/listings_clean.csv')


# VARIABLE TYPE CORRECTION ----
str(data)
data$host_name <- as.character(data$host_name)


# COLOR PALETTE AND FONTS ----
# We used the colors of the Airbnb logo for our charts.
color1 = rgb(255/255, 90/255, 96/255, 1)
color2 = 'white'
color3 = 'black'
color4 = rgb(90/255, 101/255, 255/255, 1)
font1 = 'Impact'
font2 = 'Trebuchet MS'
spacing <-15


# DISTRIBUTIONS ----
################################################################
png(filename="plots/review_scores_rating.png", width = 900, height = 600)
ggplot(data=data, aes(data$review_scores_rating)) +
  geom_histogram(col= color1,
                 aes(fill=color1),binwidth = 2, fill = color1) +
  xlim(40,100)+ scale_y_continuous(labels = comma, limits = c(0,3000))+
  theme_tufte(base_size = 5, ticks=F)+
  theme(plot.margin = unit(c(10,10,10,10),'pt'),
        axis.title=element_blank(),
        axis.text = element_text(colour = color3, size = 10, family = font2),
        axis.text.x = element_text(hjust = 1, size = 10, family = font2),
        legend.position = 'None',
        plot.background = element_rect(fill = color2, color=color2))
grid.text(unit(0.2, 'npc'), unit(0.9,"npc"), check.overlap = T,just = "left",
          label="Review Scores Rating",
          gp=gpar(col=color1, fontsize=16, fontfamily = font2))
dev.off()
################################################################
png(filename="plots/number_reviews.png", width = 900, height = 600, units = "px")
ggplot(data=data, aes(data$number_of_reviews)) +
  geom_histogram(col= color1,
                 aes(fill=color1),binwidth = 5, fill = color1) +
  xlim(0,300)+ ylim(0,500)+
  theme_tufte(base_size = 5, ticks=F)+
  theme(plot.margin = unit(c(10,10,10,10),'pt'),
        axis.title=element_blank(),
        axis.text = element_text(colour = color3, size = 10, family = font2),
        axis.text.x = element_text(hjust = 1, size = 10, family = font2),
        legend.position = 'None',
        plot.background = element_rect(fill = color2, color=color2))
grid.text(unit(0.6, 'npc'), unit(0.9,"npc"), check.overlap = T,just = "left",
          label="Number of Reviews",
          gp=gpar(col=color1, fontsize=16, fontfamily = font2))
dev.off()
################################################################
png(filename="plots/price_2_nights_2_people.png", width = 900, height = 600, units = "px")
ggplot(data=data, aes(data$price_two_nights_two_people)) +
  geom_histogram(col= color1,
                 aes(fill=color1),binwidth = 5, fill = color1) +
  xlim(25,140)+ ylim(0,150)+
  theme_tufte(base_size = 5, ticks=F)+
  theme(plot.margin = unit(c(10,10,10,10),'pt'),
        axis.title=element_blank(),
        axis.text = element_text(colour = color3, size = 10, family = font2),
        axis.text.x = element_text(hjust = 1, size = 10, family = font2),
        legend.position = 'None',
        plot.background = element_rect(fill = color2, color=color2))
grid.text(unit(0.2, 'npc'), unit(0.9,"npc"), check.overlap = T,just = "left",
          label="Price for 2 nights for 2 guests",
          gp=gpar(col=color1, fontsize=16, fontfamily = font2))
dev.off()
################################################################
png(filename="plots/beds.png", width = 900, height = 600, units = "px")
ggplot(data=data, aes(data$beds)) +
  geom_histogram(col= color1, breaks=seq(0, 4, by=1),
                 aes(fill=color1), fill = color1) +
  theme_tufte(base_size = 5, ticks=F)+
  theme(plot.margin = unit(c(10,10,10,10),'pt'),
        axis.title=element_blank(),
        axis.text = element_text(colour = color3, size = 10, family = font2),
        axis.text.x = element_text(hjust = 1, size = 10, family = font2),
        legend.position = 'None',
        plot.background = element_rect(fill = color2, color=color2))+ scale_y_continuous(labels = comma)
grid.text(unit(0.7, 'npc'), unit(0.9,"npc"), check.overlap = T,just = "left",
          label="Beds",
          gp=gpar(col=color1, fontsize=16, fontfamily = font2))
dev.off()
################################################################
ggplot(data=data, aes(data$accommodates)) +
  geom_histogram(col=color1, breaks=seq(0, 9, by=1),
                 aes(fill=color1), fill = color1) +
  theme_tufte(base_size = 5, ticks=F)+
  theme(plot.margin = unit(c(10,10,10,10),'pt'),
        axis.title=element_blank(),
        axis.text = element_text(colour = color3, size = 10, family = font2),
        axis.text.x = element_text(hjust = 1, size = 10, family = font2),
        legend.position = 'None',
        plot.background = element_rect(fill = color2, color=color2))+ scale_y_continuous(labels = comma)
grid.text(unit(0.7, 'npc'), unit(0.9,"npc"), check.overlap = T,just = "left",
          label="Accomodates",
          gp=gpar(col=color1, fontsize=16, fontfamily = font2))
################################################################
ggplot(data=data, aes(data$bathrooms)) +
  geom_histogram(col=color1, breaks=seq(0, 4, by=1),
                 aes(fill=color1), fill = color1) +
  theme_tufte(base_size = 5, ticks=F)+
  theme(plot.margin = unit(c(10,10,10,10),'pt'),
        axis.title=element_blank(),
        axis.text = element_text(colour = color3, size = 10, family = font2),
        axis.text.x = element_text(hjust = 1, size = 10, family = font2),
        legend.position = 'None',
        plot.background = element_rect(fill = color2, color=color2))+ scale_y_continuous(labels = comma)
grid.text(unit(0.7, 'npc'), unit(0.9,"npc"), check.overlap = T,just = "left",
          label="Bathrooms",
          gp=gpar(col=color1, fontsize=16, fontfamily = font2))
################################################################
ggplot(data=data, aes(data$host_total_listings_count)) +
  geom_histogram(col= color1, breaks=seq(0, 6, by=1),
                 aes(fill=color1), fill = color1) +
  theme_tufte(base_size = 5, ticks=F)+
  theme(plot.margin = unit(c(10,10,10,10),'pt'),
        axis.title=element_blank(),
        axis.text = element_text(colour = color3, size = 10, family = font2),
        axis.text.x = element_text(hjust = 1, size = 10, family = font2),
        legend.position = 'None',
        plot.background = element_rect(fill = color2, color=color2))+ scale_y_continuous(labels = comma)
grid.text(unit(0.6, 'npc'), unit(0.9,"npc"), check.overlap = T,just = "left",
          label="Host's Total Listings",
          gp=gpar(col=color1, fontsize=16, fontfamily = font2))
################################################################
ggplot(data=data, aes(data$price)) +
  geom_histogram(col= color1,
                 aes(fill=color1),binwidth = 10, fill = color1) +
  xlim(0,600)+
  theme_tufte(base_size = 5, ticks=F)+
  theme(plot.margin = unit(c(10,10,10,10),'pt'),
        axis.title=element_blank(),
        axis.text = element_text(colour = color3, size = 10, family = font2),
        axis.text.x = element_text(hjust = 1, size = 10, family = font2),
        legend.position = 'None',
        plot.background = element_rect(fill = color2, color=color2))+ scale_y_continuous(labels = comma)
grid.text(unit(0.7, 'npc'), unit(0.9,"npc"), check.overlap = T,just = "left",
          label="Price",
          gp=gpar(col=color1, fontsize=16, fontfamily = font2))
################################################################
ggplot(data=data, aes(data$weekly_price)) +
  geom_histogram(col= color1,
                 aes(fill=color1),binwidth = 10) +
  xlim(0,400)+ ylim(0,300)+
  theme_tufte(base_size = 5, ticks=F)+
  theme(plot.margin = unit(c(10,10,10,10),'pt'),
        axis.title=element_blank(),
        axis.text = element_text(colour = color3, size = 10, family = font2),
        axis.text.x = element_text(hjust = 1, size = 10, family = font2),
        legend.position = 'None',
        plot.background = element_rect(fill = color2, color=color2))
grid.text(unit(0.2, 'npc'), unit(0.9,"npc"), check.overlap = T,just = "left",
          label="Weekly Price",
          gp=gpar(col=color1, fontsize=16, fontfamily = font2))
################################################################
ggplot(data=data, aes(data$monthly_price)) +
  geom_histogram(col= color1,
                 aes(fill=color1),binwidth = 10, fill = color1) +
  xlim(0,380)+ ylim(0,140)+
  theme_tufte(base_size = 5, ticks=F)+
  theme(plot.margin = unit(c(10,10,10,10),'pt'),
        axis.title=element_blank(),
        axis.text = element_text(colour = color3, size = 10, family = font2),
        axis.text.x = element_text(hjust = 1, size = 10, family = font2),
        legend.position = 'None',
        plot.background = element_rect(fill = color2, color=color2))
grid.text(unit(0.6, 'npc'), unit(0.9,"npc"), check.overlap = T,just = "left",
          label="Monthly Price",
          gp=gpar(col=color1, fontsize=16, fontfamily = font2))
################################################################
ggplot(data=data, aes(data$security_deposit)) +
  geom_histogram(col= color1,
                 aes(fill=color1),binwidth = 3, fill = color1) +
  xlim(0,180)+ ylim(0,140)+
  theme_tufte(base_size = 5, ticks=F)+
  theme(plot.margin = unit(c(10,10,10,10),'pt'),
        axis.title=element_blank(),
        axis.text = element_text(colour = color3, size = 10, family = font2),
        axis.text.x = element_text(hjust = 1, size = 10, family = font2),
        legend.position = 'None',
        plot.background = element_rect(fill = color2, color=color2))
grid.text(unit(0.2, 'npc'), unit(0.9,"npc"), check.overlap = T,just = "left",
          label="Security Deposit",
          gp=gpar(col=color1, fontsize=16, fontfamily = font2))
################################################################
ggplot(data=data, aes(data$cleaning_fee)) +
  geom_histogram(col= color1,
                 aes(fill=color1),binwidth = 10,fill=color1) +
  xlim(0,380)+ ylim(0,150)+
  theme_tufte(base_size = 5, ticks=F)+
  theme(plot.margin = unit(c(10,10,10,10),'pt'),
        axis.title=element_blank(),
        axis.text = element_text(colour = color3, size = 10, family = font2),
        axis.text.x = element_text(hjust = 1, size = 10, family = font2),
        legend.position = 'None',
        plot.background = element_rect(fill = color2, color=color2))
grid.text(unit(0.6, 'npc'), unit(0.9,"npc"), check.overlap = T,just = "left",
          label="Cleaning Fee",
          gp=gpar(col=color1, fontsize=16, fontfamily = font2))
################################################################
ggplot(data=data, aes(data$minimum_nights)) +
  geom_histogram(col= color1,
                 aes(fill=color1),binwidth = 5, fill = color1) +
  xlim(0,100)+ ylim(0,150)+
  theme_tufte(base_size = 5, ticks=F)+
  theme(plot.margin = unit(c(10,10,10,10),'pt'),
        axis.title=element_blank(),
        axis.text = element_text(colour = color3, size = 10, family = font2),
        axis.text.x = element_text(hjust = 1, size = 10, family = font2),
        legend.position = 'None',
        plot.background = element_rect(fill = color2, color=color2))
grid.text(unit(0.6, 'npc'), unit(0.9,"npc"), check.overlap = T,just = "left",
          label="Minimum Nights",
          gp=gpar(col=color1, fontsize=16, fontfamily = font2))
################################################################
ggplot(data=data, aes(data$maximum_nights)) +
  geom_histogram(col= color1,
                 aes(fill=color1),binwidth = 5, fill = color1) +
  xlim(26,200)+ ylim(0,130)+
  theme_tufte(base_size = 5, ticks=F)+
  theme(plot.margin = unit(c(10,10,10,10),'pt'),
        axis.title=element_blank(),
        axis.text = element_text(colour = color3, size = 10, family = font2),
        axis.text.x = element_text(hjust = 1, size = 10, family = font2),
        legend.position = 'None',
        plot.background = element_rect(fill = color2, color=color2))
grid.text(unit(0.6, 'npc'), unit(0.9,"npc"), check.overlap = T,just = "left",
          label="Maximum Nights",
          gp=gpar(col=color1, fontsize=16, fontfamily = font2))
################################################################
ggplot(data=data, aes(data$availability_30)) +
  geom_histogram(col= color1,
                 aes(fill=color1),binwidth = 2, fill = color1) +
  xlim(0,35)+ scale_y_continuous(labels = comma,limits = c(0,1500))+
  theme_tufte(base_size = 5, ticks=F)+
  theme(plot.margin = unit(c(10,10,10,10),'pt'),
        axis.title=element_blank(),
        axis.text = element_text(colour = color3, size = 10, family = font2),
        axis.text.x = element_text(hjust = 1, size = 10, family = font2),
        legend.position = 'None',
        plot.background = element_rect(fill = color2, color=color2))
grid.text(unit(0.6, 'npc'), unit(0.9,"npc"), check.overlap = T,just = "left",
          label="Availability 30",
          gp=gpar(col=color1, fontsize=16, fontfamily = font2))
################################################################
ggplot(data=data, aes(data$availability_60)) +
  geom_histogram(col= color1,
                 aes(fill=color1),binwidth = 2, fill = color1) +
  xlim(0,70)+ ylim(0,800)+
  theme_tufte(base_size = 5, ticks=F)+
  theme(plot.margin = unit(c(10,10,10,10),'pt'),
        axis.title=element_blank(),
        axis.text = element_text(colour = color3, size = 10, family = font2),
        axis.text.x = element_text(hjust = 1, size = 10, family = font2),
        legend.position = 'None',
        plot.background = element_rect(fill = color2, color=color2))
grid.text(unit(0.6, 'npc'), unit(0.9,"npc"), check.overlap = T,just = "left",
          label="Availability 60",
          gp=gpar(col=color1, fontsize=16, fontfamily = font2))
################################################################
ggplot(data=data, aes(data$availability_90)) +
  geom_histogram(col= color1,
                 aes(fill=color1),binwidth = 2, fill = color1) +
  xlim(0,100)+ ylim(0,660)+
  theme_tufte(base_size = 5, ticks=F)+
  theme(plot.margin = unit(c(10,10,10,10),'pt'),
        axis.title=element_blank(),
        axis.text = element_text(colour = color3, size = 10, family = font2),
        axis.text.x = element_text(hjust = 1, size = 10, family = font2),
        legend.position = 'None',
        plot.background = element_rect(fill = color2, color=color2))
grid.text(unit(0.6, 'npc'), unit(0.9,"npc"), check.overlap = T,just = "left",
          label="Availability 90",
          gp=gpar(col=color1, fontsize=16, fontfamily = font2))
################################################################
ggplot(data=data, aes(data$availability_365)) +
  geom_histogram(col= color1,
                 aes(fill=color1),binwidth = 2, fill = color1) +
  xlim(0,200)+ ylim(0,550)+
  theme_tufte(base_size = 5, ticks=F)+
  theme(plot.margin = unit(c(10,10,10,10),'pt'),
        axis.title=element_blank(),
        axis.text = element_text(colour = color3, size = 10, family = font2),
        axis.text.x = element_text(hjust = 1, size = 10, family = font2),
        legend.position = 'None',
        plot.background = element_rect(fill = color2, color=color2))
grid.text(unit(0.6, 'npc'), unit(0.9,"npc"), check.overlap = T,just = "left",
          label="Availability 365",
          gp=gpar(col=color1, fontsize=16, fontfamily = font2))
################################################################
ggplot(data=data, aes(data$reviews_per_month)) +
  geom_histogram(col= color1,
                 aes(fill=color1),binwidth = 1, fill = color1) +
  xlim(7,15)+ ylim(0,50)+
  theme_tufte(base_size = 5, ticks=F)+
  theme(plot.margin = unit(c(10,10,10,10),'pt'),
        axis.title=element_blank(),
        axis.text = element_text(colour = color3, size = 10, family = font2),
        axis.text.x = element_text(hjust = 1, size = 10, family = font2),
        legend.position = 'None',
        plot.background = element_rect(fill = color2, color=color2))
grid.text(unit(0.6, 'npc'), unit(0.9,"npc"), check.overlap = T,just = "left",
          label="Reviews per Month",
          gp=gpar(col=color1, fontsize=16, fontfamily = font2))
################################################################
ggplot(data=data, aes(data$review_scores_accuracy)) +
  geom_histogram(col= color1,
                 aes(fill=color1),binwidth = 1, fill = color1) +
  xlim(0,8)+ ylim(0,100)+
  theme_tufte(base_size = 5, ticks=F)+
  theme(plot.margin = unit(c(10,10,10,10),'pt'),
        axis.title=element_blank(),
        axis.text = element_text(colour = color3, size = 10, family = font2),
        axis.text.x = element_text(hjust = 1, size = 10, family = font2),
        legend.position = 'None',
        plot.background = element_rect(fill = color2, color=color2))
grid.text(unit(0.2, 'npc'), unit(0.9,"npc"), check.overlap = T,just = "left",
          label="Review Scores Accuracy",
          gp=gpar(col=color1, fontsize=16, fontfamily = font2))
################################################################
ggplot(data=data, aes(data$review_scores_cleanliness)) +
  geom_histogram(col= color1,
                 aes(fill=color1),binwidth = 1, fill = color1) +
  xlim(0,6)+ ylim(0,40)+
  theme_tufte(base_size = 5, ticks=F)+
  theme(plot.margin = unit(c(10,10,10,10),'pt'),
        axis.title=element_blank(),
        axis.text = element_text(colour = color3, size = 10, family = font2),
        axis.text.x = element_text(hjust = 1, size = 10, family = font2),
        legend.position = 'None',
        plot.background = element_rect(fill = color2, color=color2))
grid.text(unit(0.1, 'npc'), unit(0.9,"npc"), check.overlap = T,just = "left",
          label="Review Scores Cleanliness",
          gp=gpar(col=color1, fontsize=16, fontfamily = font2))
################################################################
ggplot(data=data, aes(data$review_scores_checkin)) +
  geom_histogram(col= color1,
                 aes(fill=color1),binwidth = 1, fill = color1) +
  xlim(0,6.5)+ ylim(0,21)+
  theme_tufte(base_size = 5, ticks=F)+
  theme(plot.margin = unit(c(10,10,10,10),'pt'),
        axis.title=element_blank(),
        axis.text = element_text(colour = color3, size = 10, family = font2),
        axis.text.x = element_text(hjust = 1, size = 10, family = font2),
        legend.position = 'None',
        plot.background = element_rect(fill = color2, color=color2))
grid.text(unit(0.1, 'npc'), unit(0.9,"npc"), check.overlap = T,just = "left",
          label="Review Scores Check-In",
          gp=gpar(col=color1, fontsize=16, fontfamily = font2))
################################################################
ggplot(data=data, aes(data$review_scores_communication)) +
  geom_histogram(col= color1,
                 aes(fill=color1),binwidth = 1, fill = color1) +
  xlim(0,6.5)+ ylim(0,21)+
  theme_tufte(base_size = 5, ticks=F)+
  theme(plot.margin = unit(c(10,10,10,10),'pt'),
        axis.title=element_blank(),
        axis.text = element_text(colour = color3, size = 10, family = font2),
        axis.text.x = element_text(hjust = 1, size = 10, family = font2),
        legend.position = 'None',
        plot.background = element_rect(fill = color2, color=color2))
grid.text(unit(0.45, 'npc'), unit(0.9,"npc"), check.overlap = T,just = "left",
          label="Review Scores Communication",
          gp=gpar(col=color1, fontsize=16))
################################################################
ggplot(data=data, aes(data$review_scores_location)) +
  geom_histogram(col= color1,
                 aes(fill=color1),binwidth = 1, fill = color1) +
  xlim(0,6.5)+ ylim(0,10)+
  theme_tufte(base_size = 5, ticks=F)+
  theme(plot.margin = unit(c(10,10,10,10),'pt'),
        axis.title=element_blank(),
        axis.text = element_text(colour = color3, size = 10, family = font2),
        axis.text.x = element_text(hjust = 1, size = 10, family = font2),
        legend.position = 'None',
        plot.background = element_rect(fill = color2, color=color2))
grid.text(unit(0.1, 'npc'), unit(0.9,"npc"), check.overlap = T,just = "left",
          label="Review Scores Location",
          gp=gpar(col=color1, fontsize=16, fontfamily = font2))


# SCATTER PLOTS ----
################################################################
png(filename="plots/price_number_reviews.png", width = 900, height = 600, units = "px")
ggplot(data, aes(data$price, data$number_of_reviews, color = color1)) +
  geom_point(shape = 16, size = 1, show.legend = FALSE) +
  scale_x_continuous(labels = comma, limits = c(0,600))+ scale_y_continuous(labels = comma, limits = c(0,300))+
  theme_tufte()+ labs(x = "Price", y='Number of Reviews')+
  theme(axis.ticks = element_blank(),
        axis.text.y.left = element_text(hjust = 1.5, family = font2),
        axis.text.x.bottom = element_text(vjust = 5, family = font2))
grid.text(unit(0.5, 'npc'), unit(0.9,"npc"), check.overlap = T,just = "left",
          label="Price and Number of Reviews",
          gp=gpar(col=color1, fontsize=16, fontfamily = font2))
dev.off()
################################################################
png(filename="plots/price_review_scores_rating.png", width = 900, height = 600, units = "px")
ggplot(data, aes(data$price, data$review_scores_rating, color = color1)) +
  geom_point(shape = 16, size = 1, show.legend = FALSE) +
  ylim(40,100) +scale_x_continuous(labels = comma, limits = c(0,1000))+
  theme_tufte()+ labs(x = "Price", y='Review Scores Rating')+
  theme(axis.ticks = element_blank(),
        axis.text.y.left = element_text(hjust = 1.5, family = font2),
        axis.text.x.bottom = element_text(vjust = 5, family = font2))
grid.text(unit(0.55, 'npc'), unit(0.2,"npc"), check.overlap = T,just = "left",
          label="Price and Review Scores Rating",
          gp=gpar(col=color1, fontsize=14, fontfamily = font2))
dev.off()
################################################################
ggplot(data, aes(data$price, data$availability_365, color = color1)) +
  geom_point(shape = 16, size = 1, show.legend = FALSE) +
  ylim(0,400) +scale_x_continuous(labels = comma, limits = c(0,1000))+
  theme_tufte()+ labs(x = "Price", y='Availability 365')+
  theme(axis.ticks = element_blank(),
        axis.text.y.left = element_text(hjust = 1.5, family = font2),
        axis.text.x.bottom = element_text(vjust = 5, family = font2))
grid.text(unit(0.5, 'npc'), unit(0.95,"npc"), check.overlap = T,just = "left",
          label="Price and Availability 365",
          gp=gpar(col=color1, fontsize=16, fontfamily = font2))
################################################################
ggplot(data, aes(data$weekly_price, data$price_two_nights_two_people, color = color1)) +
  geom_point(shape = 16, size = 1, show.legend = FALSE) +
  xlim(0,500)+ scale_y_continuous(labels = comma, limits = c(0,2500))+
  theme_tufte()+ labs(x = "Price", y='Price for 2 Nights and 2 People')+
  theme(axis.ticks = element_blank(),
        axis.text.y.left = element_text(hjust = 1.5, family = font2),
        axis.text.x.bottom = element_text(vjust = 5, family = font2))
grid.text(unit(0.35, 'npc'), unit(0.9,"npc"), check.overlap = T,just = "left",
          label="Price and Price for 2 Nights and 2 People",
          gp=gpar(col=color1, fontsize=14, fontfamily = font2))


# OTHER PLOTS ----
################################################################
png(filename="plots/type_neighborhood.png", width = 900, height = 600, units = "px")
ggplot(data,aes(x = data$neighbourhood, fill = data$instant_bookable)) +
  geom_bar()+
  theme_tufte(ticks=FALSE, base_size = 8)+ scale_y_continuous(labels=comma)+scale_fill_manual(values = alpha(c(color1, color4)))+
  theme(legend.position = 'None',
        axis.text.x = element_text(angle = 90, hjust = 1, size = 8),
        axis.title = element_blank(),
        axis.text.y  = element_text(size = 8, family = font2))
grid.text(0.95, unit(1,"npc") - unit(0.9,"line"), check.overlap = T,just = "right",vjust = 2,
          label=paste("Instant Book",paste(rep(" ",spacing), collapse='')),
          gp=gpar(col=color4, fontsize=16,fontface="bold"))
grid.text(0.95, unit(1,"npc") - unit(1,"line"), check.overlap = T,just = "right",
          label=paste("Pending Approval",paste(rep(" ",spacing), collapse='')),
          gp=gpar(col=color1, fontsize=16,fontface="bold"))
dev.off()
################################################################
png(filename="plots/type_cancellation.png", width = 900, height = 600, units = "px")
ggplot(data,aes(x = data$cancellation_policy, fill = data$room_type)) +
  geom_bar()+
  theme_tufte(ticks=FALSE, base_size = 8)+ scale_y_continuous(labels=comma)+scale_fill_manual(values = alpha(c(color1, color4,'green3')))+
  theme(legend.position = 'None',
        axis.text.x = element_text(angle = 35, hjust = 1, size = 10),
        axis.title = element_blank(),
        axis.text.y  = element_text(size = 8, family = font2))

grid.text(1, unit(1,"npc") - unit(0.9,"line"), check.overlap = T,just = "right",vjust = 2,
          label=paste("Private Room",paste(rep(" ",spacing), collapse='')),
          gp=gpar(col=color4, fontsize=14,fontface="bold"))
grid.text(1, unit(1,"npc") - unit(1,"line"), check.overlap = T,just = "right",
          label=paste("Entire Home/Apt",paste(rep(" ",spacing), collapse='')),
          gp=gpar(col=color1, fontsize=14,fontface="bold"))
dev.off()
################################################################
png(filename="plots/type_host.png", width = 900, height = 600, units = "px")
ggplot(data[data$host_is_superhost != "",],aes(x = data$neighbourhood, fill = data$host_is_superhost)) +
  geom_bar()+
  theme_tufte(ticks=FALSE, base_size = 8)+ scale_y_continuous(labels=comma) + scale_fill_manual(values = alpha(c(color4, color1)))+
  theme(legend.position = 'None',
        axis.text.x = element_text(angle = 90, hjust = 1, size = 8),
        axis.title = element_blank(),
        axis.text.y  = element_text(size = 8, family = font2))

grid.text(0.95, unit(1,"npc") - unit(0.9,"line"), check.overlap = T,just = "right",vjust = 2,
          label=paste("Superhost",paste(rep(" ",spacing), collapse='')),
          gp=gpar(col=color1, fontsize=16,fontface="bold"))
grid.text(0.95, unit(1,"npc") - unit(1,"line"), check.overlap = T,just = "right",
          label=paste("Host",paste(rep(" ",spacing), collapse='')),
          gp=gpar(col=color4, fontsize=16,fontface="bold"))
dev.off()
################################################################
ggplot(data,aes(x = data$host_response_time[data$host_response_time!=c('NA')], fill = data$host_is_superhost)) +
  geom_bar()+ scale_fill_manual(values = alpha(c(color1, color4)))+
  theme_tufte(ticks=FALSE, base_size = 8)+ scale_y_continuous(labels=comma)+
  theme(legend.position = 'None',
        axis.title = element_blank(),
        axis.text.x  = element_text(size = 8, family = font2),
        axis.text.y  = element_text(size = 8, family = font2))

grid.text(0.95, unit(1,"npc") - unit(0.9,"line"), check.overlap = T,just = "right",vjust = 2,
          label=paste("Superhost",paste(rep(" ",spacing), collapse='')),
          gp=gpar(col=color4, fontsize=16,fontface="bold"))
grid.text(0.95, unit(1,"npc") - unit(1,"line"), check.overlap = T,just = "right",
          label=paste("Host",paste(rep(" ",spacing), collapse='')),
          gp=gpar(col=color1, fontsize=16,fontface="bold"))
################################################################
ggplot(data,aes(x = data$room_type, fill = data$host_is_superhost)) +
  geom_bar()+ scale_y_continuous(labels=comma)+scale_fill_manual(values = alpha(c(color1, color4)))+
  theme_tufte(ticks=FALSE, base_size = 8)+
  theme(legend.position = 'None',
        axis.title = element_blank(),
        axis.text.x  = element_text(size = 8, family = font2),
        axis.text.y  = element_text(size = 8, family = font2))

grid.text(0.95, unit(1,"npc") - unit(0.9,"line"), check.overlap = T,just = "right",vjust = 2,
          label=paste("Superhost",paste(rep(" ",spacing), collapse='')),
          gp=gpar(col=color4, fontsize=16,fontface="bold"))
grid.text(0.95, unit(1,"npc") - unit(1,"line"), check.overlap = T,just = "right",
          label=paste("Host",paste(rep(" ",spacing), collapse='')),
          gp=gpar(col=color1, fontsize=16,fontface="bold"))
################################################################
ggplot(data,aes(x = data$neighbourhood, fill = data$is_location_exact)) +
  geom_bar()+
  theme_tufte(ticks=FALSE, base_size = 8)+ scale_y_continuous(labels=comma)+scale_fill_manual(values = alpha(c(color1, color4)))+
  theme(legend.position = 'None',
        axis.text.x = element_text(angle = 90, hjust = 1, size = 8),
        axis.title = element_blank(),
        axis.text.y  = element_text(size = 8, family = font2))

grid.text(1.1, unit(1,"npc") - unit(0.9,"line"), check.overlap = T,just = "right",vjust = 2,
          label=paste("Location Accurate",paste(rep(" ",spacing), collapse='')),
          gp=gpar(col=color4, fontsize=16,fontface="bold"))
grid.text(1.1, unit(1,"npc") - unit(1,"line"), check.overlap = T,just = "right",
          label=paste("Location Not Accurate",paste(rep(" ",spacing), collapse='')),
          gp=gpar(col=color1, fontsize=16,fontface="bold"))
################################################################
ggplot(data,aes(x = data$cancellation_policy, fill = data$host_is_superhost)) +
  geom_bar()+
  theme_tufte(ticks=FALSE, base_size = 8)+ scale_y_continuous(labels=comma)+scale_fill_manual(values = alpha(c(color1, color4)))+
  scale_x_discrete()+
  theme(legend.position = 'None',
        axis.text.x = element_text(angle = 35,hjust = 1, size = 7),
        axis.title = element_blank(),
        axis.text.y  = element_text(size = 8, family = font2))

grid.text(1.1, unit(1,"npc") - unit(0.9,"line"), check.overlap = T,just = "right",vjust = 2,
          label=paste("Superhost",paste(rep(" ",spacing), collapse='')),
          gp=gpar(col=color4, fontsize=16,fontface="bold"))
grid.text(1.1, unit(1,"npc") - unit(1,"line"), check.overlap = T,just = "right",
          label=paste("Host",paste(rep(" ",spacing), collapse='')),
          gp=gpar(col=color1, fontsize=16,fontface="bold"))
Data Visualization in Carto
A map has been designed in Carto and provides detailed information to the user.
Top 10 attractions are marked with yellow pin points, with the area to avoid displayed in red (500m). Distance from these attractions is then displayed by 500m ranges until 2km.
Available listings are displayed by points, with higher ratings being in lighter color, and with cheaper prices being of larger diameter. This allows the best choices to stand out from the dark background.
Neighborhoods borders can also be displayed, and the listings filtered based on the user’s criteria.
The map can be displayed in full screen on Carto.
